
Data processing in research
 Data processing in research is a process that transforms raw data into a usable form. It includes data acquisition, cleaning, integration, transformation, reduction, and preparation for analysis, ensuring the accuracy and reliability of results. Whether a study uses quantitative or qualitative data, data processing forms the foundation on which research is based.
Stages of research data processing
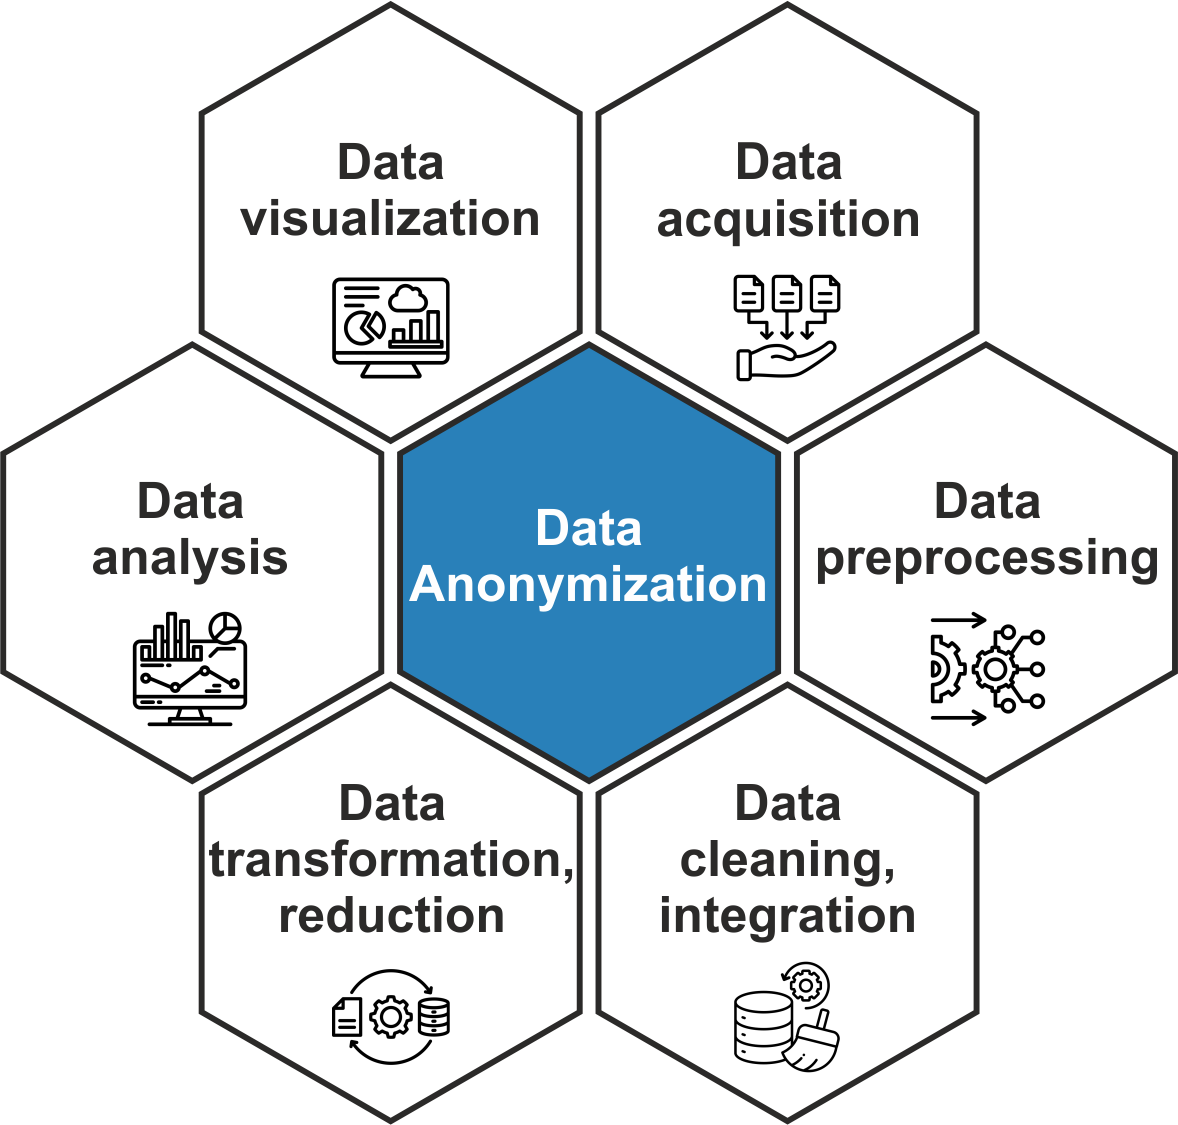
Research data processing can be divided into several related stages:
data acquisition – collecting and recording the data required for the research in an appropriate volume, quality, and format;
data preprocessing – checking data quality, identifying and correcting erroneous or incomplete values, handling missing data, and reducing noise. Depending on the needs of the study, normalization may also be performed at this stage to ensure data comparability;
data analysis – examining the processed data using statistical, mathematical, and modeling methods to identify relationships and trends, and to support scientifically grounded conclusions;
data visualization – presenting results in a structured and visually comprehensible form (for example, charts, graphs, maps, or interactive visualizations), which facilitates interpretation and communication.
Research data processing is a dynamic and iterative process – data are regularly reviewed, supplemented, and refined throughout the course of the study. At every stage, it is particularly important to adhere to the principles of security, confidentiality, and privacy.
This section briefly summarizes the main stages of data processing, from data acquisition to analysis, and also reviews the most commonly used tools.
Importance of data preprocessing
Data preprocessing is important because it helps to ensure the accuracy and consistency of information and prepares the data for further analysis. If data are not properly prepared, even well-collected datasets may lead to incorrect conclusions.
Main stages of data preprocessing
The data processing process usually includes the following stages:
data acquisition – collecting data from various sources (surveys, sensors, databases, etc.);
data cleaning – identifying and correcting errors, missing values, and duplicates;
data integration – combining data from different sources into a unified structure;
data transformation – converting data into an appropriate format and scale;
data reduction – reducing the volume of data while preserving essential information.
The choice and level of detail of these stages depend on the objectives of the research, the characteristics of the available data, and the analytical methods applied.
Data acquisition is the first stage in the preprocessing process and largely determines the quality of subsequent work. Its purpose is to systematically collect the information necessary to answer research questions or test hypotheses. Data can be obtained directly (for example, through surveys, experiments, interviews, observations, or measurements) or indirectly by using existing sources (such as statistical databases, business registers, sensor data, archives, or data repositories, etc.).
Principles of data acquisition:
accuracy – data should be collected in a manner that accurately reflects the real situation while minimizing potential errors;
systematic process – data collection should be planned and carried out consistently, following a unified methodology;
objectivity – subjective judgments and influence on respondents or data sources should be avoided;
ethics and security – confidentiality, data protection regulations, and personal data processing requirements (such as GDPR) must be respected;
appropriate format – data should be collected in a structure and format that allows convenient processing and analysis (for example, in tables, CSV files, or databases).
Methods of data acquisition
The data acquisition process can be either automated (for example, sensor networks or online data collection using software tools) or manual (for example, conducting interviews or completing questionnaires). The choice between these methods depends on the research objectives, resources, the type of data, and their availability.
Types of data
Data are commonly divided into two main types: qualitative and quantitative. Qualitative data describe phenomena in a descriptive and contextual way, capturing individuals’ experiences and viewpoints. They typically include texts, interviews, observations, or visual materials that help reveal the underlying aspects of the research problem. Quantitative data, on the other hand, consist of numerical information that allows researchers to measure, compare, and analyze phenomena using statistical methods. They make it possible to identify trends and patterns within larger datasets.
In qualitative research, it is essential to ensure that the data are rich in context and depth and reflect the complexity of the studied phenomenon. In quantitative research, the focus is on ensuring that the data are accurate, reliable, and comparable. In both cases, the quality of the data acquisition process determines the possibilities for further data use and analysis.
Data cleaning is a step in the data processing workflow that aims to ensure that inaccuracies and errors in the data do not influence analysis results or decision-making. Its purpose is to improve the accuracy, completeness, and consistency of the data.
Main steps of data cleaning:
handling missing values (for example, replacing them with the mean, median, or values based on the analysis of similar cases);
resolving inconsistencies in formats and measurement units (for example, date formats);
removing or correcting errors and duplicate records;
identifying and handling outliers (unusual or extreme values);
checking the logical validity of data (for example, a person’s age cannot be negative).
Some of the most commonly used tools for data cleaning include OpenRefine, Data Wrangler, Python (pandas, NumPy), and R.
Research data often originates from multiple sources, such as surveys, information systems, measurement devices, or databases. To use it effectively, it needs to be integrated into a unified format and structure.
The main objectives of data integration are:
to combine multiple data sources into a single dataset;
to harmonize variables (for example, ensuring that dates, measurement units, or categories are represented consistently);
to resolve inconsistencies that arise when different sources contain conflicting information;
to prepare a foundation for further data processing and analysis.
Example of data integration
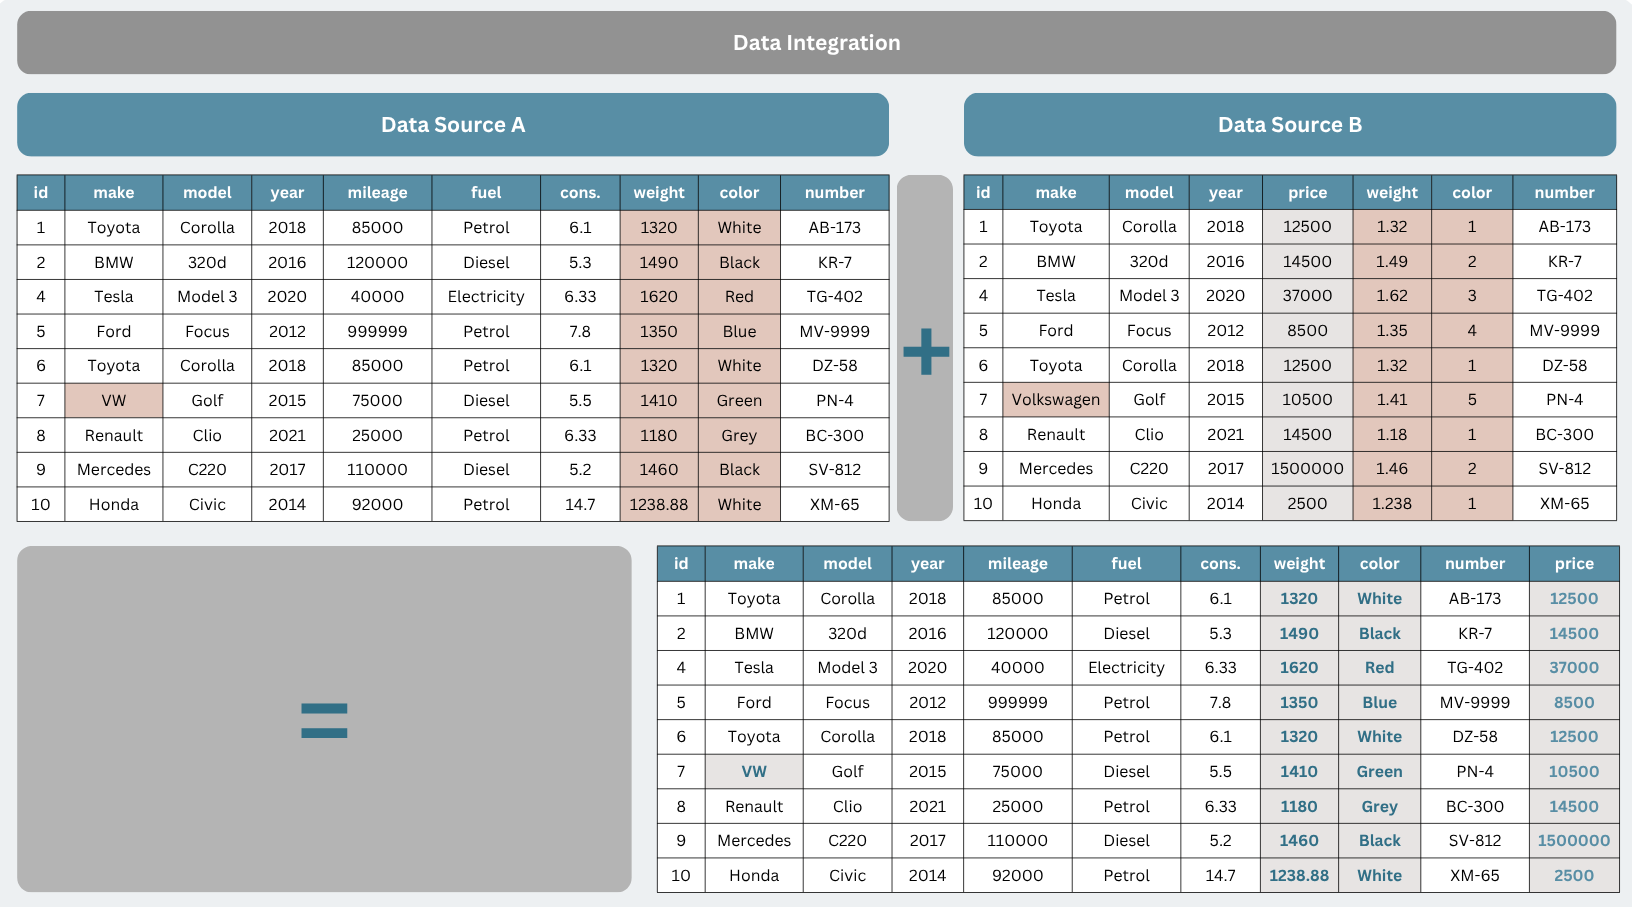
In the integration process, various tools can be used, such as SQL databases, Excel, Python (for example, the pandas merge function), or big data platforms like Apache Spark. Tools mentioned in the data cleaning section can also be applied to these tasks. Well-integrated data means that a researcher can view a complete and consistent picture of the research problem rather than fragmented datasets.
The purpose of data transformation is to prepare it for analysis, for example by normalizing, standardizing, or harmonizing measurement units. Data transformation may also include encoding categories, grouping data, creating new variables, and processing time-related entries.
Example of transformation (the image shows the normalization of a data range, which is often required before training machine learning algorithms and in other analytical tasks).
Effective data transformation often involves tailoring the data to specific analytical needs, such as creating new categories or variables that enable more accurate interpretation of research results. At this stage, both manual approaches and automated tools can be applied to efficiently process different types of data.
The purpose of data reduction is to decrease the volume of data without losing essential information. It is used to speed up processing and improve the efficiency of analysis. The most challenging task in the data reduction process is determining which data are essential and should be retained, and which can be removed without significantly affecting the results.
This can be achieved using methods such as Principal Component Analysis (PCA), feature selection, data aggregation, or grouping. This step is particularly important in big data contexts, where the volume of data is large and processing can be time-consuming.
Scientific data analysis is the process of deriving new insights about a studied phenomenon from previously processed and organized data. It involves both descriptive statistical techniques (such as calculating means, medians, and standard deviations) and more advanced methods, including regression models, analysis of variance, and time series forecasting.
Objectives and approaches of data analysis
Analysis helps to identify patterns, test hypotheses, and support conclusions with statistical indicators. The following approaches are commonly used:
descriptive analysis – summarizing data and calculating indicators of trends and dispersion;
exploratory analysis – examining the structure of data and relationships, and identifying anomalies;
inferential analysis – testing hypotheses and drawing statistical conclusions;
predictive analysis – building models to forecast future trends;
prescriptive analysis – identifying optimal solutions based on analytical results.
Data analysis tools and result interpretation
Programming languages and software designed for processing large and complex datasets are often used in data analysis, such as Python (pandas, NumPy, scikit-learn), R, as well as statistical packages like SPSS or SAS. In some fields, specialized tools are also used, such as MATLAB for engineering calculations or Stata for economic and social science analysis.
Statistical analysis tools: SPSS, R, Stata, Microsoft Excel.
Data cleaning and transformation: OpenRefine, Data Wrangler, Python (pandas, NumPy), R.
Programming and automation tools: Python (pandas, NumPy, scikit-learn), R.
Big data processing solutions: Apache Spark, Hadoop.
Data visualization tools: Tableau, Power BI, Matplotlib.
University of Illionois (2023). Data Cleaning for the Non-Data Scientist. [online] [cited 03/03/2026]. Available: https://guides.library.illinois.edu/datacleaning/tools
Stony Brook University (2026). Data Cleaning and Wrangling Guide. [online] [cited 03/03/2026]. Available: https://guides.library.stonybrook.edu/data-cleaning-and-wrangling/cleaning
O'Toole T., Cernat A., Tzavidis N., Shlomo N., Sakshaug J. (2025). Survey Practice Guide 1: Data Integration. [online] [cited 03/03/2026]. Available: https://surveyfutures.net/wp-content/uploads/2025/05/survey-practice-guide-1-data-integration.pdf
UMBC (2026). Data Integration, Analysis, and Visualization. [online] [cited 03/03/2026]. Available: https://lib.guides.umbc.edu/c.php?g=1078066&p=8197208